Cap-rate study
Starbucks cap-rate intelligence
Room to compress. Or room to cherry-pick?
← Selected Work
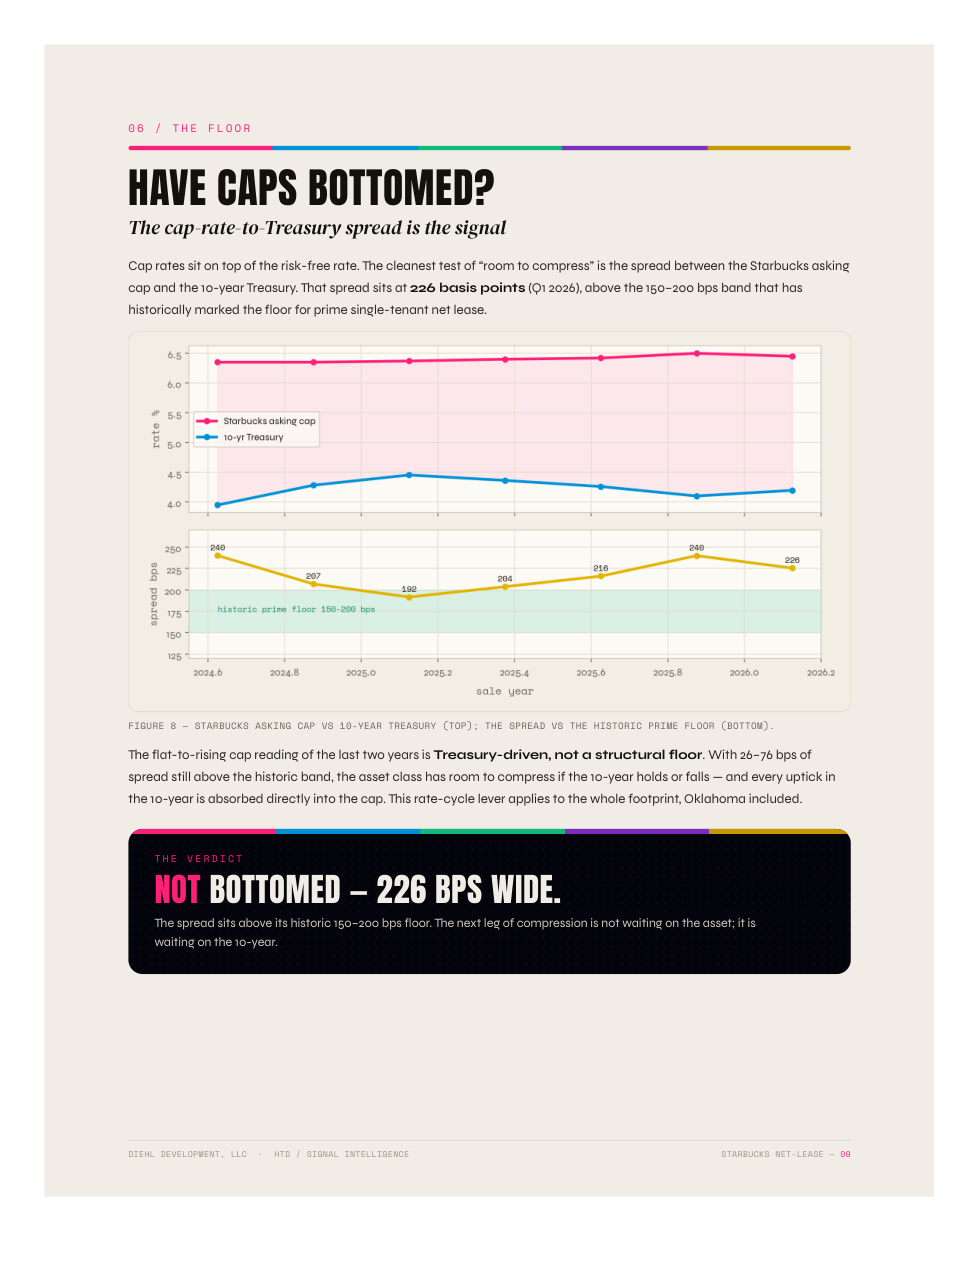
A developer client asked whether Starbucks cap rates had room to compress or whether we had already found the floor. Translation: could the same income produce a bigger sale price? Fair question. Hand me three carefully selected comps and I can make almost any argument sound expensive. So we went wider: a 500-mile radius, more than 2,500 locations, and 247 comparables mapped, sourced, checked, and separated by listing versus recorded-sale evidence. Signal Intelligence assembled the research in less than six hours on this assignment; doing that by hand would have eaten weeks of brokerage time. Impressive, but the spreadsheet was the opening act. The analysis connected regional pricing patterns with the 10-year Treasury, demographics, rents, and traffic exposure. The answer was more useful than “caps are going down”: closed transactions and ambitious asking prices were telling different stories, and the case for further compression depended on the location, income, and spread. We could finally argue about the evidence instead of whose favorite comp won the beauty contest.